Define Your Demographics

Contents
Just want a fast description of defining demos? Go here: Defining Demos: Short and Sweet.
|
Getting to the Demo Dialog
There are three ways to get to the demo dialog:
| 1. | If no demos have yet been defined, click on "New Demo" at the top left of the plansheet |
| 2. | If some demos are already defined, it's a popup at the top left. Use the popup and choose "Revise Demos...". |
| 3. | On the Demos menu, choose "Add or Revise Demos...". |
Making Choices on the Demo Dialog
There are plenty of demographic options. This pair of rules establishes how these boxes are used:
|
If there are multiple checks within a boxed-off panel, this will be treated as if we said the word "or" between the choices. So, if you check the "A County" box and also the "B County" box, then this says you want a demo that includes respondents who are from either A Counties OR B Counties. |
||
|
Using choices from different boxes say that we want both characteristics, that is, "this AND that". |
Two of the boxed panels have special behaviors:
Special rule for "Presence of Children" and "Other Characteristics" panels: |
|||
|
If there are multiple checks within a boxed-off panel, this will be treated as if we said the word "or" between the choices. So, if you check the "A County" box and also the "B County" box, then this says you want a demo that includes respondents who are from either A Counties OR B Counties. |
||
|
Using choices from different boxes say that we want both characteristics, that is, "this AND that". |
||
If you need more involved definitions, see Logic: Demos, ANDs and ORs.
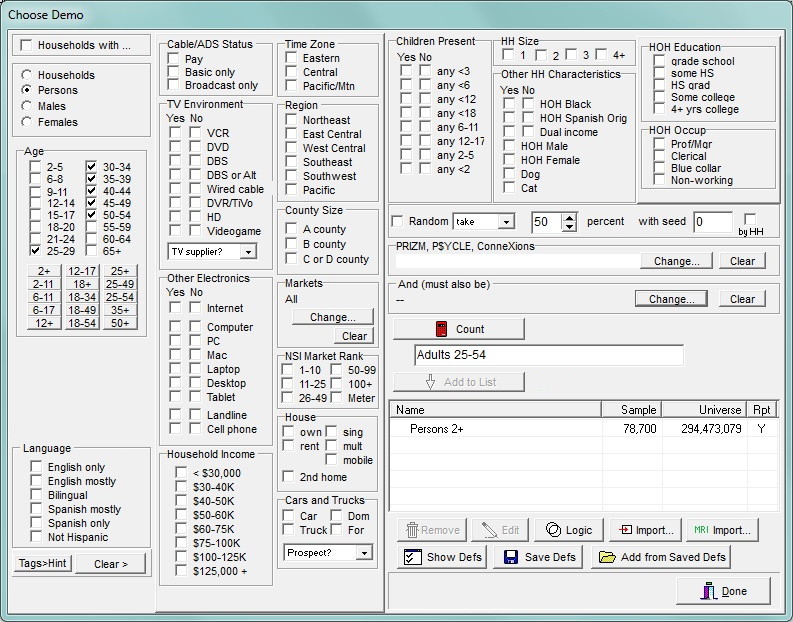
The Demo Dialog
The demo dialog will look something like this. Several specific items may be different, depending on the data sources to which you subscribe.
![]()
Click to remove all checkmark choices, except those in the first column. If the current choices define "Women 25-54 in the Northeast in cable homes that also have a DVR" and you click "Clear >", this reduces the definition to simply "Women 25-54".
Households, Sex and Age
![]()
This is rarely used, but when you need it, it's great!
You can define a target that consists of households that contain one or more persons with a specified demographic. For example, you may wish to look at homes with teenagers, or homes with a working woman. To do this, check the "Households With" checkbox at the upper left of the demo dialog, and then continue on to check boxes for the persons demographic involved. Note that the resulting definition specifies homes, not persons.

Start by selecting a gender, or households. If you choose persons, males or females, then ages become available.
If you choose females, a choice of working status appears.

Check the fine, discrete age groups you want to include. Or click the buttons to set the range you want.
Language
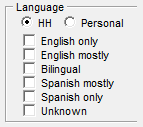
Restrict your demo by the languages used in Hispanic households.
Depending on the data source, you may be able to choose between languages used overall by the household, or by individual persons.
Planners should note the difference between these language usage choices and the Spanish origin checkbox. In general, the language choices are very interesting for research and understanding the Hispanic market, but that "HOH Spanish origin" is a more compatible match with how Latino-targeted TV programming is bought and sold.
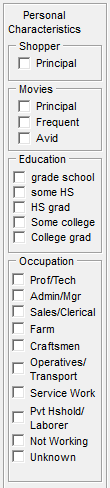
Personal Characteristics
When using U. S. Nielsen's All-Minute data, you may have access to a wider range of demographics concerning individual persons, rather than concerning the households they are members of.
Cable

To limit the demo to homes with any cable, whether basic only or basic plus pay, click both of those boxes.
Wired, Satellite, DVR, Computers, and Other Electronics
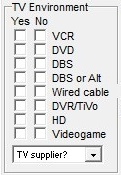
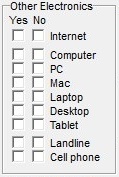
What techie toys are in the home? Define your demo accordingly. (As a reminder, what exactly is shown here will depend on the data sources to which you subscribe.)
Please note that you can select out a demo by whether the home uses hard-wired-cable or DBS (satellite TV). If you are actually using wired cable or satellite TV in an advertising plan (such as placed with NCC Media), you should also learn about the use of the "Constraint" column on the main Table view for specifying your plan elements.
Income
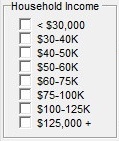
Limit your demo to people in homes with specified income levels.
Time Zones, Regions and County Sizes
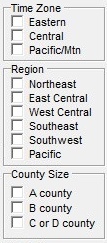
Limit your demo to people and homes in certain time zones, regions, and county sizes.
(Time zone as used here is a geographic qualifier, which tells us in which zone every U.S. respondent resides. To read about how TViewdeals with times of network programs, read Define Days and Times in the section about scripts.)
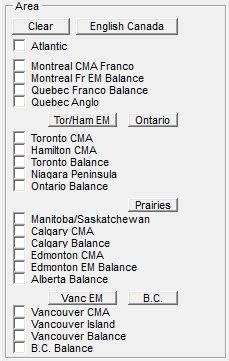
Of course, these will be different with different data sources or in countries other than the U.S. For example, here is what TView shows when using Canadian Numeris data:
And here are the choices when using Latin American IBOPE data:
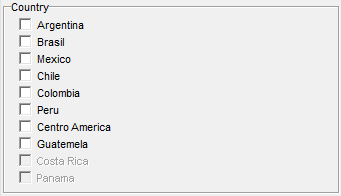
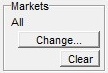
Individual Markets and Market Ranges
If your data source provides it, you can even define your demo down to local markets. For more, read Local Market Media and Planning.
As an example, here are choices available when using U.S. Nielsen data:
![]()
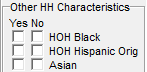
Black, Hispanic, and Other Household Characteristics
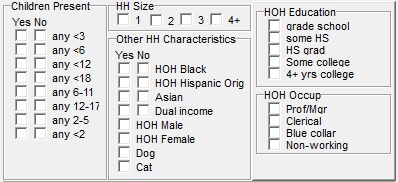
There are a passel of ways to restrict a demo to homes or persons with certain household characteristics.
Of crucial special interest are these characteristics defined by Nielsen:
Note that these characteristics are on a household basis, not on a personal basis.
Planners should also note the difference between the language usage choices and the Spanish origin checkbox. In general, the language choices are very interesting for research and understanding the Hispanic market, but that "HOH Spanish origin" is a more compatible match with how Latino-targeted TV programming is bought and sold.
Also take a look at the case study, "Planning for General and Hispanic Campaigns". It offers a number of ideas on how to analyze dual-target plans.
Random Draw of Respondents
![]()
![]()
With this panel you can restrict your demo to just some of the available respondents, taken on a random draw.
Why on earth would you want to do that?
One possibility is to judge the value of an optimization. Maybe an optimization seemed to work. But did it, really? The random drawn can be used for such purposes as seeing results in two separate matched samples, or for constructing a optimization crossvalidation test. To learn about that, read Demo Subsets and Cross-Validation.
Another possible use is to simulate a media vehicle as a proxy, perhaps based on some vehicle that is more readily available. This might be used along with the "Constraint" column in the main Table view.
Note that there are three different ways to use this panel:

In the popup next to the word "Random" you can choose the settings "take" or "discard" to set a percentage of respondents to be included or not. Or, choose the setting "group" to divide up the panelists into a number of random groups, and then select one of them.
For more on that "group" setting, and about the "seed" and "by HH" items, see Demo Subsets and Cross-Validation.
And (Must Also Be)
![]()
While creating a demo, you can say that the respondents chosen must also be members of some previously defined demo.
Read more about this on the topic, Logic: Demos, ANDs and ORs.
Geodemographics
![]()
Birds of a feather flock together, or so they say. Find out more here: Geodemographics: PRIZM, P$YCLE and ConneXions.
Count and Add to List

After you make your demo choices, a count needs to be made of the number of respondents in the survey panel meeting your demo definition. This determines whether there is a sufficient number of respondents in the demo you specified to justify tabulations. This is also crucial for identifying which respondents we want to analyze.
To do this, click the "Count" button. TView will then show the respondent count.
As you made your checkmark choices, TView attempted to construct a nice name for the demo. Inspect it, and make changes if you desire.
After the demo has been defined and counted, and a name has been given to it, you can add this new demo to your list of demos to be analyzed. Just click the "Add to List" button. (If the Add to List button is greyed out, it probably means that you have not yet counted your demo.)
Prepared demos are shown in a list:

Refinements and Conveniences
These buttons give you access to more tools for defining demos:
|
Select a demo and click "Remove" to say goodbye to it. (You may not be able to remove a demo if it is currently in use to set costs or a GRP entry.) |
|
Click on the name of the demo in the list at the lower left of the demo dialog. Then click the "Edit" button. A dialog then lets you edit the demo's name.
Note that you can edit a demo's name but not its underlying definition in this manner. If you want to replace a demo with a demo defined differently, use "Remove" to jettison the old demo and then add a new demo as usual. |
|
Need to combine demos in some way? Click here. This is particularly valuable when you need to mix Nielsen demos with demos you've imported from MRI. Read more at Logic: Demos, ANDs and ORs. |
|
Import demo definitions from such services as Nielsen Catalina or Nielsen Spectra. Read about this at Importing a Demo. |
|
You can study media exposure against women 21 to 44 who like peanut butter, use coupons and write letters to the editor! (That assumes you buy the needed data access.) All the details are here: Using MRI (Mediamark) in TView. |
|
This simply prepares a text summary on the "Report" tab giving details about the demos currently defined. |
|
Save your demo definitions, and then re-use them in a different plansheet! Click "Save Defs", give your list a name, and then in another plansheet use "Add from Saved Defs". |
Done with Demos
When you're done with creating demos for now, click "Done".
![]()