Demo Subsets and Cross-Validation

Contents
Great, your optimization produced a plan with a higher reach!
But in any media system that does an optimization, whether it's for television, or magazines, or online, or whatever, a nagging question remains: This procedure produced a higher reach within this surveyed group; but would the same plan revision also produce better results in another group? After all, if we are just improving what happens within a survey panel, it may not have much applicability to saying what would happen in the real world!
A Cross-Validation Example
A cross-validation test helps to determine if results are projectable. That is, are we optimizing performance against the universe at large, or are we merely improving delivery to the Nielsen panel?
Here's the problem: You note the reach performance of a plan, and then you observe an improved reach after running an optimization. BUT ... are we really able to say that the optimized plan would actually be better in real life? When media components are defined too narrowly, there is a real risk that the supposed "optimization" is doing nothing more then cherry-picking in order to move specific Nielsen respondents into the "reached" group! For example, is TView moving some weight into a daypart just in order to reach Nielsen-enlisted button-pusher Alice Keller on Burlington Ave. in Billings, Montana? Or will that plan change have a desirable effect more broadly?
Cross-validation is the defense against such aberrations. In TView we can "optimize" a plan against one demo subsample. Then, by observing whether the "improved" plan is actually better against a "fresh" matched demo, we have reassurance that it will actually do better in real life.
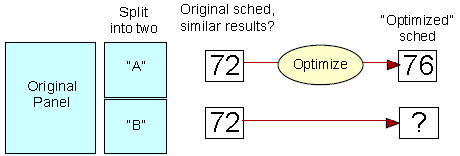
The test uses a cross-validation design. Divide the Nielsen panel into two groups randomly (a cool capability that's possible with respondent-based data!) In the illustration, suppose we see that a schedule generates about a 72 reach in both subsets. So far, that's good: it tells us that the schedule performs the same when replicated against two groups. Next, take one subset, and optimize the schedule against it. Now, observe the performance of the same schedule against the other half. If the reach against the "fresh" group is markedly below that of the first group (as suggested in the illustration) then you've learned that the optimization was not projectable!
Cross-validation finds that daypart-level optimization generally tests fairly well, whereas program level optimization is more likely to accomplish little other than to reach the Nielsen panel better.
Cross-Validation in TView
To tackle cross-validation, TView can draw subsamples from survey panel respondents using these controls on the Demographics dialog:
![]()
With subsamples we can make changes to a plan using information from one group of people, and then see if the good results persist on a fresh group of people. This is called cross-validation.
If the "Random" box is checked, TView will randomly draw a specified portion of the respondents identified by the other demo choices. For example, Women 25-54 may have a sample count of 1,775 respondents. Using this box, you can randomly "take" about 50% of them, or about 887 people, to be in your demo definition. If you want another demo with everybody left over, change the popup to "discard".
Groups
Conceptually, TView's random draw feature can also randomly assigns each home (or respondent) into one of a number of "groups". You specify how many such groups are to exist. Then, you specify which of these groups you want to use to define a demo.
![]()
For example, if you want to randomly draw half of the respondents, you could choose "group" from the popup menu and say that you want two groups. Then define a demo from group #1. If you then want to create another demo with all of the people who weren't chosen for that first demo, you can define another demo based on group #2.
With two demos defined in this way, you can do a cross-validation test on an optimization, for example. You could do an optimization against the first group, and then look at the performance of the supposedly optimized plan against the second group.
Seed
The "seed" box is used to re-seed the random number generator used to draw the groups. If the seed value isn't changed, the same random draws will be made if another demo is selected. To choose another random breakout, supply a different seed number.
By HH
You can also control whether persons are kept together by homes when the random draws are made. For example, suppose that these two homes are in the panel:
Home |
Persons in this home |
1234 Wright Lane |
Larry, age 41 Mary, age 38 Audrey, age 16 Greg, age 17 |
567 Goddard Drive |
Jack, age 46 Karen, age 44 Carlyn, age 13 Jenny, age 14 Tom, age 15 Steve, age 17 |
So, there are two homes and six teenagers. Now consider what happens if we ask for Persons 12-17, and for a random draw of 50% of the panel. Is a coin flipped (figuratively speaking) for each teenager individually? Or, do we make a random draw for each home and then if a home is selected, include its teens? For most analytic purposes, this distinction is unimportant. However, in a few special cases it might be vital, and TView provides you with both options. To make a random choice for each home, check the "by HH" checkbox. To make a random choice for each person individually, make sure that the "by HH" checkbox is unchecked.