Exploring Duplication Between Plans

Contents
The "Duplication / Venn" command on the Explore menu adds powerful analytic and visualize tool for understanding patterns of duplication.
The commands and tools we'll discuss here explore what happens when two of your plansheet plans are combined. With these we'll address such puzzles as:
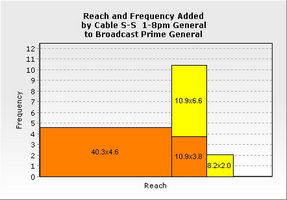
| • | How much does cable add to a broadcast plan? |
| • | What is the overlap in the audience of news networks and entertainment networks? |
| • | Does late night television add reach that we're not getting already with Prime alone? |
| • | Are we adding reach or frequency or both? |
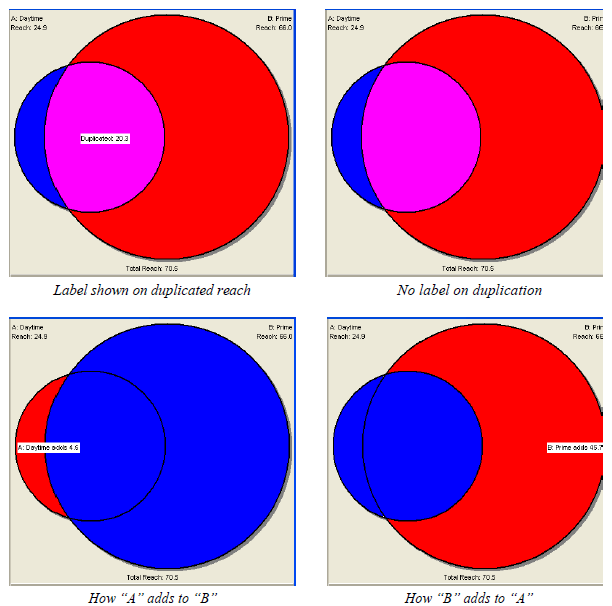
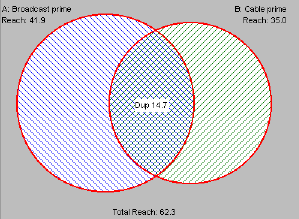
Here are some samples of the duplication charts you can produce:
|
|
|
|
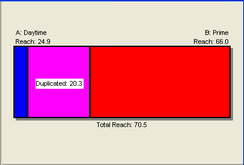
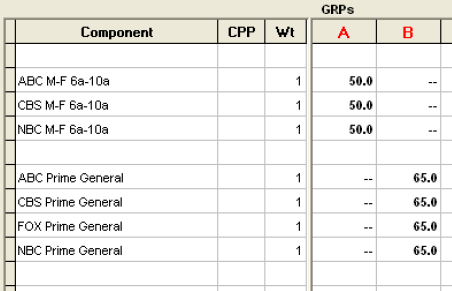
Specify what you wish to combine as separate plans. To explore duplication between network daytime and prime time, say, set up two plans, one for each daypart. After the two schedules to be combined have each been entered as separate plans, select both of the plan columns. For example, you can click on the letter header for one column, and then command-click on the letter header for the other plan column.
The "Duplication" command on the Explore menu is available when two plan letters are selected.
Here is where things get cool: Note that anything that can be placed in a column can be used in a Duplication. This means you can study ...
| • | combinations of viewing options: Broadcast and Cable |
| • | combinations of schedules: My intro plan and my sustaining plan |
| • | combinations of dayparts: Prime and Daytime |
| • | combinations of networks: News networks and entertainment networks |
| • | combinations of genres: Sitcoms and Reality shows |
... and so on. Be imaginative!
For example, if you want to see how Discovery and TLC combine with each other in prime time, you could create a Discovery schedule using column A and a TLC schedule in column B.
To Look at Duplication
To start, select two plans. Then, choose the "Duplication / Venn" command on the Explore menu.
Chart Styles
A variety of duplication charts are available:
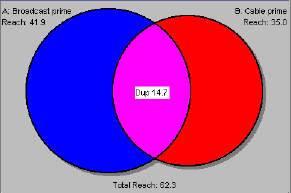
| • | Venn diagrams (overlapping circles) |
They each are discussed in the linked sections.
Highlight
Since all of these charts are intended for use in presentations, a "Highlight" button is provided to toggle between different ways of displaying the duplication:
Changing the Size
The window holding the duplication graphic can be re-sized. Just change the size of the window to change the size of the graphic.
Copy
Any of these duplication charts can be copied to the clipboard by clicking the "Copy" button.
To copy the contents of one of the tabular results boxes, right click on it. To save the numeric results in one of the tabular results boxes, right click on it.
Color / Black and White
A checkbox is available to display the duplication diagram as a black and white pattern, which is very handy when a report will be duplicated on a black and white copier.
![]()
Here is an example of a Venn chart rendered in black and white:
In color plots, you can change the background color by clicking on this palette:
![]()