Quilt Plots of Plan Duplication

Contents
Note: Read Exploring Duplication Between Plans for an introduction to all of the techniques, buttons and widgets that can be used in understanding plan duplication. |
All of the chart styles in the right-hand column produce what we call "quilt charts."

This very powerful (and unique) ability of the Duplication procedure in TView lets you take a look at a whole pattern of what happens when GRPs are varied in two plans.
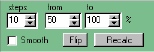
This group of settings lets you specify a range of GRP weights to be used in looking at duplication. For the settings as shown, TView will look at 10 steps of GRP levels, ranging from 50 percent of the plan weight up to the full plan weight (100 percent). Every weight level revision of one of the revised plans is mixed with every weight level revision of the other, producing many variations.
The results are first summarized numerically in a table:

Various result values can also be shown graphically in a color grid.
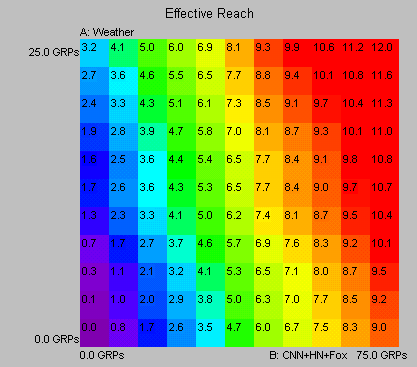
Here is an example. We're looking to see what happens when Weather Channel is added to a schedule of three news networks (for some daypart). First we consider Weather all by itself. This is shown in the leftmost vertical column: this column denotes 0 GRPs on the other networks, and as we go higher, this denotes more GRPs on Weather. All by itself, 25 points on Weather produces an Effective Reach of 3.2 (for this daypart and ER definition). But even when the other three news networks are all used at 25 points each (this is shown in the rightmost column), adding Weather still boosts ER by 3.0 points, from 9.0 to 12.0.
Results
The colors in the plotted grid can represent any of these result values:
Choice |
What It Is |
GRPs, Reach, ER |
These are the computed results of the combination of the two revised plans. |
Expect Reach |
This is the reach that would be "expected" (as it's called) if two duplication of the two schedules was completely random. The expected intersection (duplicated reach) of two plans equals the product of the two reaches, expressed as decimals. For example, if two plans each have a reach of 60, then the expected intersection is 0.60 * 0.60, which is 0.36, or 36 percent of the target. The total net reach is then the sum of the two reaches, minus this intersection (since it was counted twice when the two plans were added). We write this as:
Total = A + B - AB
The expected reach for two plans each with 60 reach is thus 60 + 60 - 36, or 84. |
Actual - Expect |
This is the actual computed reach minus the expected reach. This shows by how many points the reach varies from the "expectation." |
F (mult) |
Another way to express duplication is via a so-called "F factor." If the intersection of two plans is estimated by multiplying reaches (that is: AB) then we might say that the actual intersection is this expected value times some "F" value. The total reach is then:
Total = A + B - FAB
This is easily solved for F with a little algebra. The resulting F is used by many media researchers as a measure of duplication. |
F (exp) |
This is the same idea, but uses a different formulation of F:
Total = A + B - (AB)F |
Show Values
You can opt to have the actual values shown in each colored square, or, just to show the pure colors with a legend to identify the values.
Here is a plot with "Show values" checked:
![]()
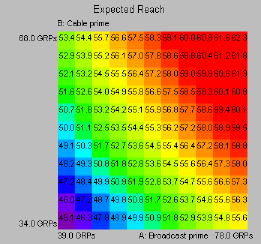
Here is the same plot with "Show values" unchecked:
![]()

Smooth
If a graphic seems to have "islands" where values don't seem to follow smoothly from adjoining areas, try checking the "Smooth" box and then click "Recalc." TView switches between a variety of methods in order to provide the most efficient calculations. However, this sometimes produces results that are a bit counterintuitive. When you check the "Smooth" box, TView uses a single method for all calculations. This takes a little more time, but yields more pleasing results.
Steps
As a default, TView tries 10 steps in each of the two directions. To create even smoother charts, you might try boosting the number of steps to a larger number, such as 20. This will take quite a bit longer, since TView has to calculate 400 schedules (20 by 20) instead of 100 (10 by 10). The payoff is that it does make a very nice chart for presentation purposes. You might try doing your explorations quickly with a lower number of steps, say 5 to 8, and then changing the steps to a larger number to prepare a final chart for presentation.