Bar Charts of Plan Duplication

Contents
Note: Read Exploring Duplication Between Plans for an introduction to all of the techniques, buttons and widgets that can be used in understanding plan duplication. |
Bar Chart
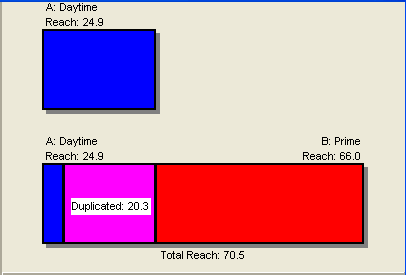
The basic bar chart has the same information as the Venn diagram, but as a bar with three segments rather than as intersecting circles:

Bar, Add
This shows the effect of adding the second component to the first. The first component is shown as the top bar. When the second component is added to it, we have added reach, but also part of the length of the original bar is now shown as duplication.
If the components are not in the order desired (you want to show how day adds to prime, rather that how prime adds to day), click the "Flip" button.
Bar, Predict
If two media or two vehicles have completely independent patterns of viewership, we say they are independent. This specialized chart illustrates whether two components combine independently or not.
