Add Reach or Add Frequency

Contents
Note: Read Exploring Duplication Between Plans for an introduction to all of the techniques, buttons and widgets that can be used in understanding plan duplication. |
Here's another way to show how additional weight contributes to reach, frequency, or both.
Set up a "base" plan in one column, and the "added" weight in another plan column. Select both plans by clicking and shift-clicking on their column headings:

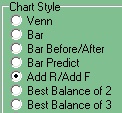
Choose the command Explore > Duplication/Venn, and on that dialog click "Add R/Add F" for a chart style:
Click the "Recalc" button for this display:

The delivery of the original plan is shown in orange, and that of the added plan is in yellow.
"Reach" is broken into three groups. At the left we see the 40.3% of our target that has seen only the base plan. On average, this group has been exposed 4.6 times. In the middle is the 10.9% of the target that has been exposed to both the base plan (an average of 3.8 times) and the added plan (an average of 6.6 times). Finally, we have people added to the overall reach who have seen only the added plan. They amount to 8.2% of the target with an average frequency of 2.0.
(Obscure fact for the deep thinkers: The total area of the four rectangles equals the GRPs in the plan.)