Venn Diagram of Plan Duplication

Contents
Note: Read Exploring Duplication Between Plans for an introduction to all of the techniques, buttons and widgets that can be used in understanding plan duplication. |
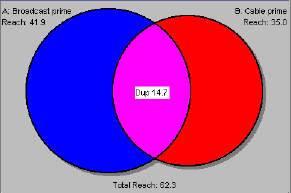
The Venn diagram is the classic illustration to show how audiences overlap and combine.
![]()
The reach of each of the two plans is shown as a circle, and the intersection represents the duplication, the portion of the target reached by both plans. The size of the circle and the duplicated area are proportional to the actual reach figures.
The underlying values are also displayed in a table:
