Improving the Network Mix

Contents
Techniques used: |
OPTIMIZE SWITCHPITCH |
Note: In this case study we'll explore how to improve the mix of networks in your plan.
The same techniques also can be used just as well to improve the mix and balance of dayparts in your plan, or other plan elements. |
FX, TBS, TNT and USA are four cable networks featuring general programming with broad appeal. But the latter three include various sports programs in their prime-time lineup, so they broaden their reach even further in simple tabs. FX concentrates on general programs, so they do not have that advantage.
But in a campaign, we may not wish to use sports at all for targeting reasons, so we need to take that into account by making better use of the FX network.
Given all this, the challenge is to make better use of these four networks, to compensate for the "sports advantage" enjoyed by some, to fit their use into a wider palette of cable choices, and to uncover hidden strengths.
Getting started ...
We started by creating a custom database for first quarter 2011. From this, we built a TView plansheet for the Adults 18-49 target, and a range of rows for the two "dayparts" of gtreat interest: a broad ROS definition, and then an evening daypart, 6-11 pm. We'll enter some very rough cost per points for illustration in thjis little example.
We've arrange the line entries so that the FX line is followed by the three main competitors, and then six other networks. Except for ESPN, we are looking at non-sports programming.
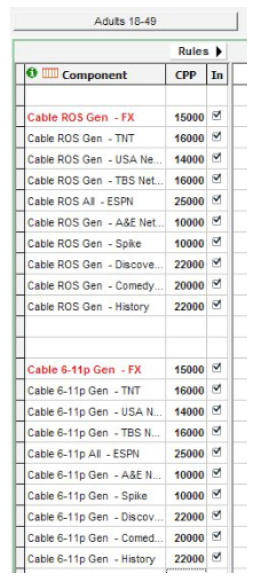
To highlight FX, we told TView to color the text and use bolding on the FX lines.
Focus on which daypart?
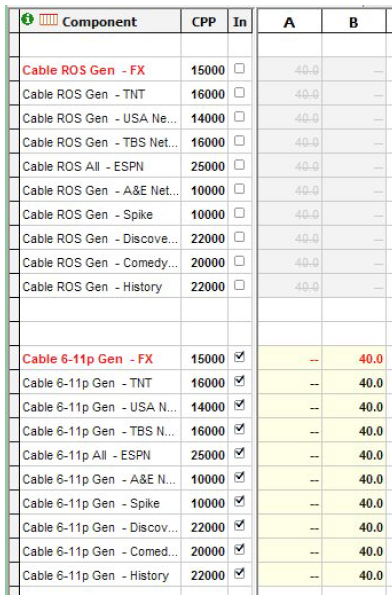
We can focus our attention on either one of the sets of dayparts with a quick option-click on the "In" column, turning each whole group either "in" or "out":
Who has the OOMPH????
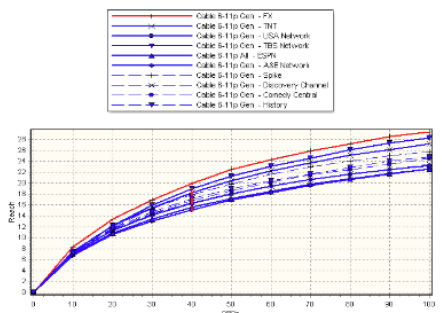
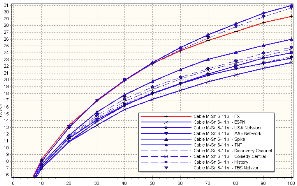
Let's look at some basic reach curve comparisons to see who has the overall reach-power for these dayparts!
FX looks great in Prime ...
... AND in Total Day...

Head-on with principal competitors
Those reach curves tell us that FX has a strong reach story.
But in a plan, we must also explore what happens when the elements of the plan come together. In this case, that means, how do FX and its competitors build audience in combination?
For an example, let's create four plans, each for $400,000, each one using just one of the networks:
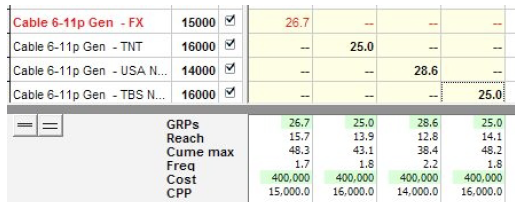
(In TView, you can click on the green areas to revise totals.)
Now we're going to look at FX in combination with each of the other networks. This will gain us insight in the head-to-head battles for audience.
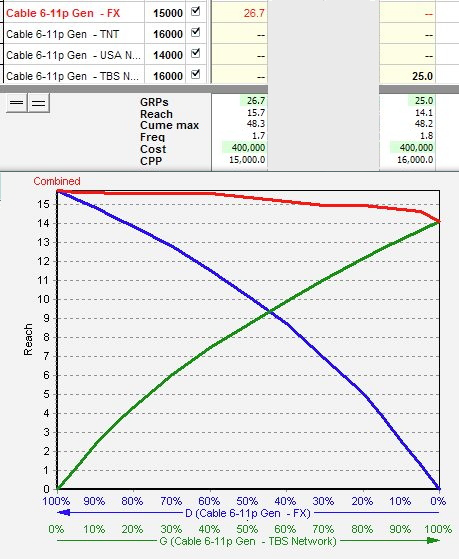
TBS + FX?
The first pair we'll look at is TBS and FX, and we'll see what happens when we spend our $400K across these two.
TView's very unique "crossed curve" chart shows what happens when you try different mixes of FX with TBS: all-FX, 90/10. 80/20, 50/50, and so on down to all-TBS. The red curve tells us that reach is best when using only FX in that two-way mix!
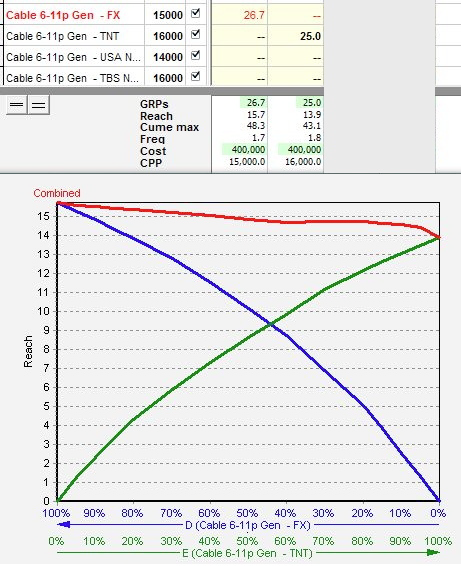
TNT + FX?
Now we pair FX with TNT, with similar results:
USA + FX?
Combining FX and USA is much more interesting! Mixing FX with USA in a head-on combination produces a more complex story:
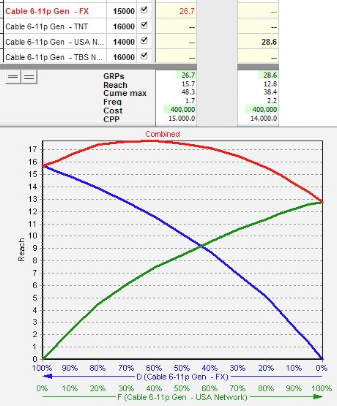
Here we learn that there is some merit in the combination of FX with USA: reach is decidedly improved with a mix of the two, rather than using one or the other. But we also note:
1) The best combination (top of the red curve) is about TWO reach points better than FX alone (the highest point of the blue curve), but almost FIVE points better than USA alone (the highest point on the green curve).
2) That ideal mix spends about 65% in FX, 35% on USA.
Hmmm. But WHY does the mix with USA produce such different results than mixing with TBS or TNT? Let's dig further ...
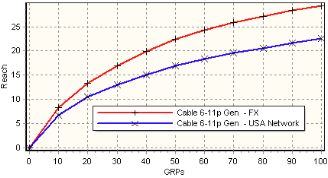
What's the deal with USA?
What makes USA different in combination with FX? A clue is found a few pages back in the "Oomph" section, where we see that USA's Prime reach curve is significantly shallower than that of FX (or TNT or TBS, for that matter). Here are the curves for only FX and USA, to see this more clearly:
Now let's look at all four principal competitors using TView's "Contributions" chart:
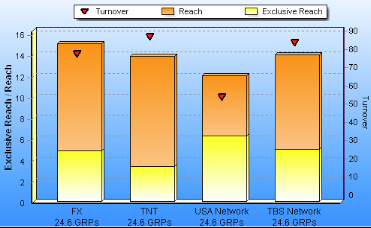
From this we learn how each of the four develops reach and exclusive reach on its own. We also said we want to see turnover. And there it is: USA has a markedly lower turnover than the other four, which keeps it from generating more reach. This also means it is developing more of its reach exclusively, so it works better in combination than do TNT or TBS.
A step beyond: a THREE-way combination
We can take one additional step in "optimizing" a plan graphically with TView's three-way Find Best Balance chart.
We'll start with FX. Then, let's use USA because we've learned that it's a useful contributor in a mix. For the three-way, let's try each of the Turner properties.
Very interestingly, our discoveries from the two-way mashups persist in three-way combinations: a mix of FX and USA is helpful, while adding either TNT or TBS has no benefit. (And, just as in the two-ways, the best mix, shown with warmer colors, is heavier on FX than on USA.)
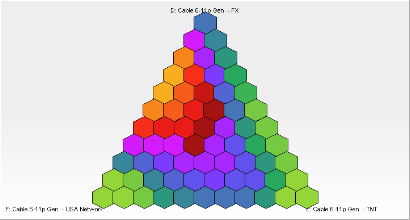
FX + USA + TNT
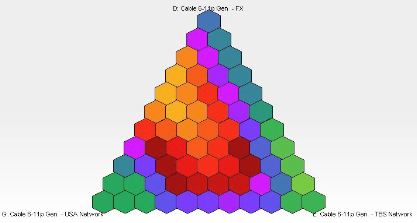
FX + USA + TBS
Putting the numbers to work!
The graphics gave us some insights into what's going on. Now we'll do some crunching on the numbers to take us further.
We create a plan for $1,500,000 using FX and its three main competitors in Prime:
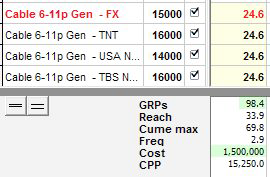
TView's "Fill" tool made this easy: We provide a total budget, and TView fills in the cells!
A "natural" use of the networks
A first step in letting TView develop a plan is to try the "natural" As-It-Falls techniques to better balance the components of the plan.
Here is some of the thinking behind TView's As-It-Falls:
| • | If one network (or daypart, or whatever) has higher ratings, it should naturally be given more GRPs in order to tap its audience) |
| • | If some option is on the air for more hours, it also gets more weight |
| • | If a network's audience listens loyally for hours to one source, we need fewer points to reach them. But if some other network has fresh audience all the time, more spots reach more people. |
Our TView tool kit for this is setup like this:
Is "natural" better?
In this case, we find that simply adjusting network placements to take advantage of their internal dynamics doesn't change the overall reach:

To explore what happens when the nets share audience, it's time for TView's OPTIMIZER!
How is the optimizer different?
The optimizer takes the internal strengths and quirks of individual options, and combines them with the audience patterns between and among them, to find the best combination.
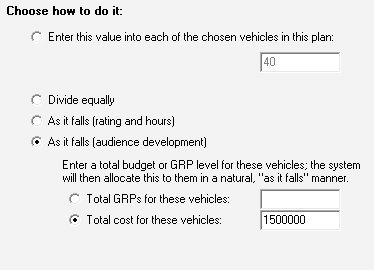
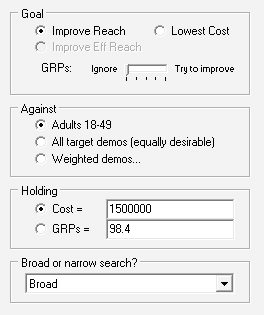
Running an optimization in TView is easy:
and then TView crunches its little heart out ...
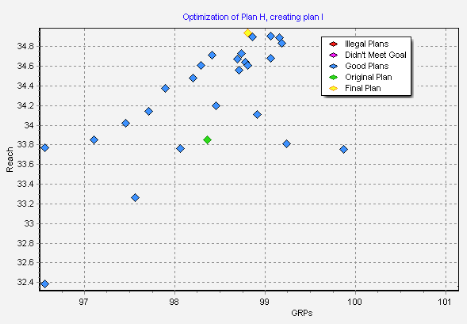
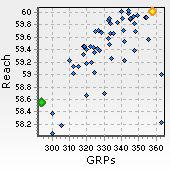
Moving from the original plan (green dot) to the final plan (yellow dot) TView improved reach by a full point! (That chart makes a nice presentation device as well!)
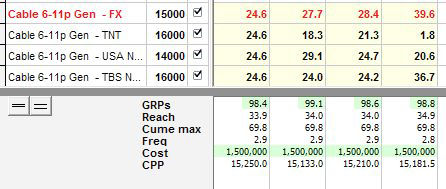
Most importantly, we have now learned that improvement is partially accomplished by heavying up on FX!
(See the last column here):
The "Media Mesa"
To be honest, once we get to a supposed "optimized" plan, usually we have a lot of choices remaining that don't much affect the results. I like to call this the "media mesa": once you climb up to the top of the mesa, you find you have lots of room where the same altitude is achieved.

For more about the Media Mesa, click here!
Using the Media Mesa to Favor a Preferred Option
As long as we have this flexibility, let's say we want to use it to see if we can use even more of the FX network.
Making such "tweaks" in a plan is a qualitative choice that is very much all about personal preferences.
To learn what we want to favor in a plan, we open TView's "Rules" panel, and choose a double-plus for FX under the ![]() column, like this:
column, like this:
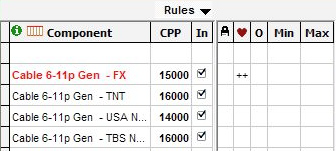
Wow! This time when we re-run the optimizer, we create an even better story for FX. Although the final reach score is fractionally less, the FX share of the plan goes from 25% (24.6/98.4) to 47% (47/99.4)!

But wait, there is a surprise here! Take a look at the TNT line, above. Why was TView so brutal on TNT? Let's find out ...
TView's Switchpitch: Many alternatives at once
Thinking about that "Media Mesa" again: We know we have many alternatives, but how far can we go, and in which directions, before we lose audience?
Enter TView's Switchpitch.
In some respects, it's a human optimizer, by hinting which directions look good!
When we start with a plan using FX and the principal three competitors in equal amounts, Switchpitch presents these 28 alternatives (7 variations applied to each of the 4 networks):

We have told TView to apply a color shading to indicate reach changes. Reddish shades denote where reach drops would occur.
Jumping out of the chart is what happens if we fiddle with TNT: those brightening greens on this table tell us to trim TNT, or remove it entirely! Take a look: cutting out TNT boosts reach by a full point. (NOW we understand why the optimizer downgraded TNT!)
All of the white cells have results with very little change in reach. Those white cells show the Media Mesa!
In TView, you can be that "human optimizer" by drilling down into green cells to generate more and continually better options. Whereas an optimizer (TView's or most others as well) can get you a better plan, Switchpitch helps you learn why a plan is better, and gives you options for further intelligent choices.
10-Network Optimize and Switchpitch
Now we'll look at creating alternatives we can suggest using the full palette of 10 networks!
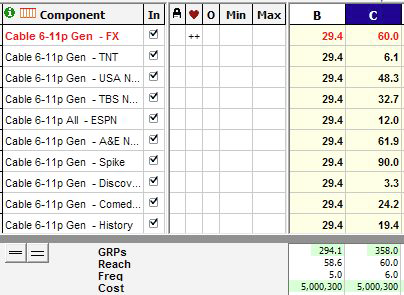
Column B shows a $5 million plan, distributed with equal weight on each net. We ran the TView optimizer, which crunched away and drove its way to a better plan:
In this case, the optimizer boosted reach by about a point and a half, and (with the help of that "++") doubled the weight placed on FX! Next let's look at alternatives ...
There are LOTS of usable alternate plans
When we attack the "optimized" plan with Switchpitch, we get the following chart.
This is exactly what we hope to see, with no green cells. (After all, this is supposed to be the "best" plan.)
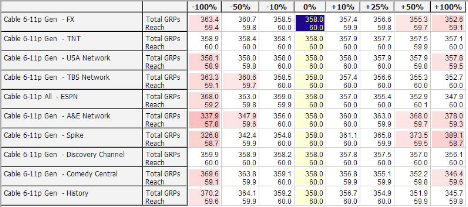
What's nifty now is that all of the white cells (the Media Mesa) are good alternatives with just about the same results. The client wants more Discovery, or not quite so much USA? Fine, you can do that, just pick an appropriate white cell! (You are even able to bring the selected plan back to the main plansheet work area with a single click!)
A puzzle about FX and sports
Most of the tinkering I've done used general (non-sports) programming on the 10 cable networks, except for ESPN. However, I did do a quick comparison of reach curves using all programming on the principal four networks.
That led to a puzzle! Here are the curves using all programming, for Prime:
No surprise there: we knew that including sports would expand the potential on TBS and TNT.
But now look at the Total Day reach curves:
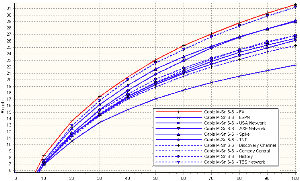
OK, FX is back on top. But this is for all programming, including sports. So, we are left with an obvious question: WHY? This suggests that FX is doing something in dayparts outside of Prime that enables it to build reach back! With a little more digging, the answer became clear ...
FX and Daytime
The answer to our puzzle is ... MOVIES.
It's FX's schedule of movies in the daytime hours that is pumping reach back. Here's TView's contributions chart for 10am to 4pm:
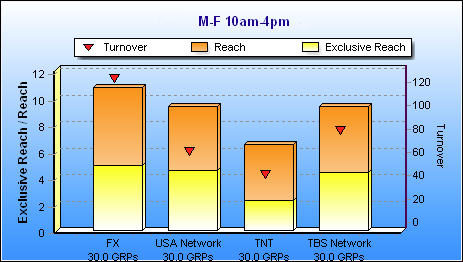
Movies are almost always a reach-builder. Unlike a continuing series that "finds" its audience and develops some measure of loyalty, individual movie titles tend to appeal to different people at different times. So, as you add placements on movies on different days, you are more likely to reach different people.
What movies do for FX in Daytime jumps out of this chart! Look at those red triangles: FX's turnover is way higher than that of the other guys, meaning it's continually bringing fresh viewers over time. The result: FX has more reach and more exclusive reach, meaning that FX has unique strengths in adding people to this 4-way mix. That strength puts FX on top of the reach curves for total day, even when we include all programming.
What We've Learned
Of course, this is just a sampling, focusing on a couple of specific dayparts, with a key demo and key competitors. The great strength of TView is that by being easy to explore, it encourages thinking about what’s happening, and that leads to better plans and schedules, and a more compelling story, not just once in a while, but for everyday media challenges.