The Best Balance of Two Plans

Contents
What's In the Two Plans Is Up To You
This function in TView finds a balance between two plans. But that means that it can find a balance for whatever it is you put in those plans. Here are some examples:
Find a nice balance ...
| • | of a broadcast plan and a cable plan |
| • | of daytime and prime |
| • | of Discovery and National Geographic |
| • | of sitcoms and dramas |
How to Balance Plans
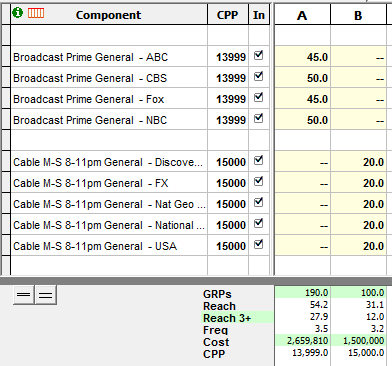
Let's say you have a budget of $2,500,000, and you are considering using selected networks on either broadcast prime or cable prime, and so far you've put together this:
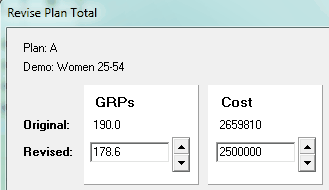
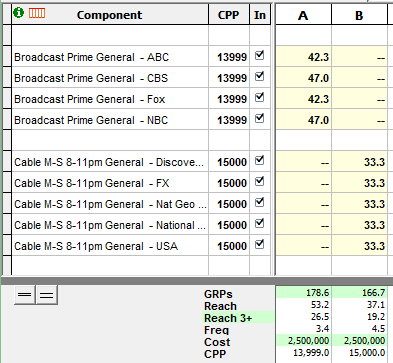
The broadcast plan is over budget, and the cable plan is under budget, so a first step is to revise them. Click in the green rectangle showing the total cost, and change the total. Do this for each plan:
Now the two plans can be compared. Spending all of our budget in broadcast produces a reach of 53.2, while spending it all on the selected cable networks yields a 37.1 reach:
But everything you know about media tells you: the best reach results are much more likely to come from a balance of these plans than from one or the other!
To find the best balance, select both plan headers (using click and shift-click):
![]()
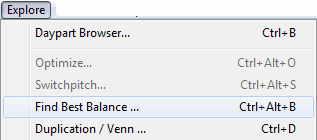
Choose "Find Best Balance" on the Explore menu:
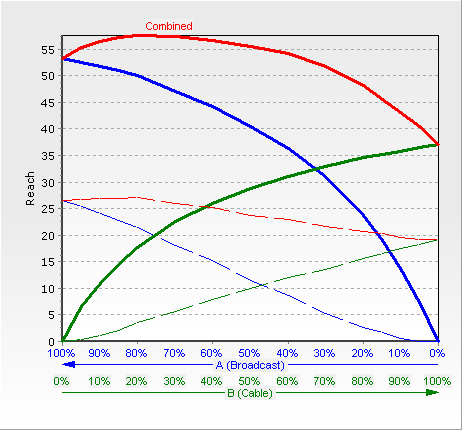
The dialog that follows will ask you to click a "Recalc" button. This chart is then created:
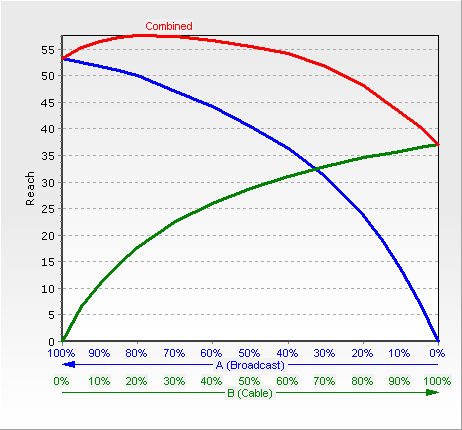
The blue line and the green lines are everyday, normal, build-up reach curves for the two plans. What's novel is that they are crossed. The green cable curve is drawn left-to-right as is typical, eventually getting to the cable plan's 37.1 reach. But the blue broadcast curve is drawn "backwards", starting at zero reach on the right edge and going up to the full 53.2 reach on the left.
With the lines crossed this way, we can think about mixing the two plans. Starting at the left edge, we have 100% of the money in broadcast, and nothing in cable. At the right edge, we have the whole budget in cable, and nothing in broadcast. In between are the possible mixes, such as 90/10/80/20, 50/50 and so on.
TView draws a red third line to show the reach results at these various mixes. At the end points, the red curve meets the other curves. But in between, there does seem to be a real advantage to balancing the two plans! By eye, it looks like the red line peaks at a reach of about 57.
Create a New Plan With the Best Balance
You click on the top of the red curve to create a new plan, like this:
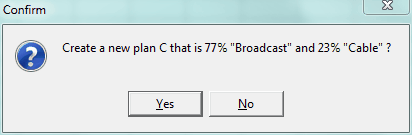
TView confirms:
Back on the plansheet, we see the new plan:
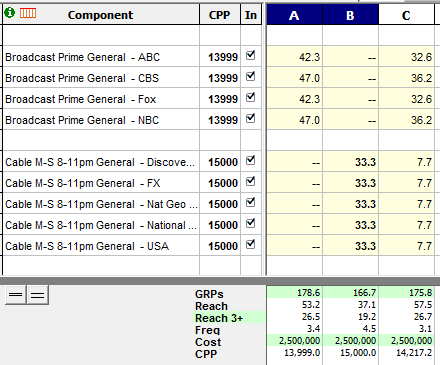
Sure enough, the balance between plan A and plan B is better than either of the originals in gaining reach!
Effective Reach
Click a checkbox on the dialog to also show how effective reach is produced at the various mixes:
![]()
The overall reach is shown in thicker solid curves, the ER is shown in thinner dashed lines.