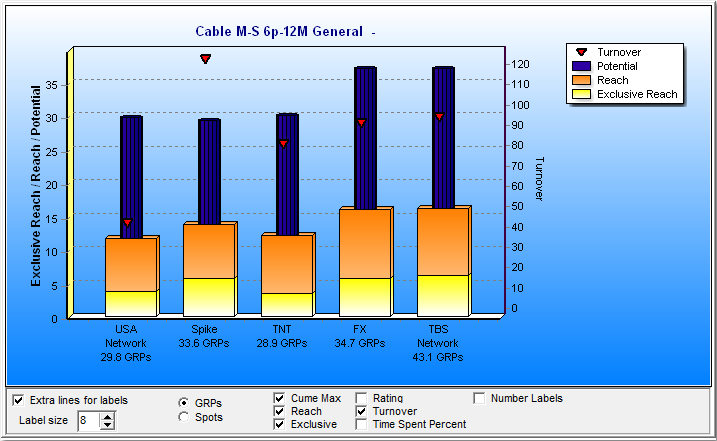
Contributions (chart)
The Contributions chart effectively at conveys what each of the elements of your plan provide to the plan's performance.

The blue cylinders tell the cume max, the total portion of the target that ever watches each option. This is interesting because no matter how much we advertise a vehicle, we can never exceed its cume max.
The orange bars show the reach that was achieved by each vehicle all by itself.
The yellow portion of the bars is the exclusive reach of each vehicle. This is the audience that was attained by a vehicle and none of the others. A good way to look at exclusive reach is that if you remove a vehicle entirely from a plan, without re-investing that weight somewhere else, you immediately lose total reach by the amount of the exclusive reach of that vehicle.
The "Extra lines for labels" checkbox and the label size setting help to improve the legibility of busy charts.
Several other measures can be added to the chart as symbols.
Also read the section on Graphic Widgets about formatting, adjustments and edits you can make to this chart.
