Import Results

Contents
TView can add a demo using data imported from various fusion studies or matching studies. Here are some examples:
| o | Mediamark Reseach (MRI) |
| o | Nielsen Catalina Solutions |
| o | Nielsen Buyer Insights |
| o | Nielsen Spectra |
| o | Mendelsohn Affluent Survey |
Learn more about using MRI fusion data here: Importing from MRI Learn more about importing from the other sources shown here: Importing a Demo |
When you click "Import", TView does its hard work of merging the imported data with the plansheet's respondents. Results are displayed in a comprehensive report:

In this example, we have imported MRI data on users of three brands of bacon.
At the very top, in large type, we learn that 4,809 respondents in the TVD database have been identified (according to the fusion data) as users of any of those three brands of bacon.
The graphic on the side provides a sense of the quality of the match. The left bar is respondents in the fusion data, the right bar is respondents in the TVD database being used. What we want to see is a nice correspondence (marked as "Match") between the two. In the example, we learn (lower left) that there were 5,636 respondents in the MRI data who were not found in the main television data; that's just fine, because we know that the chosen MRI fusion date span was wider than the date span for the television data, so some people will be included in the former who are not in the latter. We also learn (central in the graphic area) that quite a few respondents, 58,017, from the television data have no match in the fusion data. This is quite understandable, as the fusion data only reports on persons 18+, and not on children nor on households, both of which are entries in the television data.
What To Look For
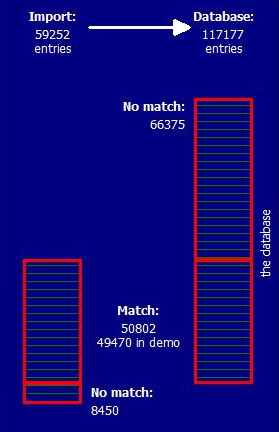
Here are examples of two attempts to import data. In both of these example, we are importing data from the MRI fusion to be matched against U.S. Nielsen respondent data.
|
|
GOOD: A medium building and a tall building! |
BAD: A very short building (with deep basement) and a tall building! |
This shows us a successful good match between the MRI fusion data (on the left) and the Nielsen data (on the right). The Nielsen bar is much taller, because we have no imported MRI info for either households or children. The MRI bar shows that some respondents couldn't be matched, and that's reasonable for a variety of reasons. |
Here we have a very poor match between the MRI respondents (on the left) and the Nielsen respondents (on the right). This suggests that an incorrect file is being imported, perhaps from a date span quite different from the data span used to pull the Nielsen data. |