Reach x Frequency Isn't Quite GRPs

Contents
|
I've noticed that in small plans using a demo with a very small sample size, the product of the reported reach and frequency sometimes is a little different than the GRPs. What's the story? |
It's a cardinal precept of media: reach times frequency equals GRPs.
But sometimes it may not quite look that way, as in this example:
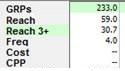
A reach of 59.0 times a frequency of 4.0 gives 236, not the 233 that we entered.
Rounding
Most or all of the difference is likely due to rounding. In the example above, if we could see more decimal places, the reach could be 58.95 (which rounds for display to 59.0) and the frequency could be 3.9525 (which rounds for display to 4.0), for a product of 58.95 x 3.9525 = 233.0, matching the plan that was entered.
If you really wanted to pursue this, there is a way to squeeze out more decimal places. These summary counts are computed from the sums for respondents, so you could look at more decimal places by going to the Details tab, Topline panel. Divide the "Reach(#)" by the universe to get reach as a percentage, and divide the impressions by the "Reach(#)" to get the frequency.
Basic rounding explains this situation for the vast portion of the time.
Rolling the Dice
But for the seriously curious there's a bit more to this story.
The GRP total shown is the sum of all GRP entries, naturally enough. This is fed to the mechanisms that make this a respondent-level, personal probability system, the buzzwords we love. Given a certain planned GRP level for ABC Prime, say, we go through all of the respondents and estimate how many times each of these people will see our ad on that daypart. This is done essentially by rolling the dice, as implied by us talking about personal probability. When we have the estimated number of exposures for each respondent, we count the number of respondents exposed, and the total number of impressions thus created.
Because of the way that's done, the product of reach and frequency may not match the input GRPs precisely. But it's going to be darn close. The main reason for this is the huge number of respondents, some 16,500 women 25-54 for example, and a substantial number of spots. Look at it this way: if you flipped a coin 10 times and got 7 heads, you wouldn't be surprised. But if you flipped 10 coins 16,500 times each, you'd certainly expect the total percentage of heads to be very close to 50%.
So, the bottom line is that this little subtlety will seldom be noticeable, and is of no real concern. The only times that total GRPs can get somewhat more noticeably distinct from reach times frequency is when the plan has a small GRP total or a small sample size (e.g., a sample of 71 for Women 25-34 in C or D counties and without cable).