Mixing in Other Media

Contents
TView is a television reach and frequency system (and also an online R&F system when used with Nielsen's "NTI+Online" fusion data). But TView is not a radio system, or a magazine system, or a system for any other media beyond television (and sometime online).
But you can use TView to combine television with radio or print or online or other media!
You can enter your own information about delivery of media other than television, and TView will show how these other media will combine with your television schedules.
More Television?
Television plan elements should always be entered using the conventional TView choices.
|
NOTE! This "other media" facility should never be used to enter anything involving broadcast, cable or satellite television. |

The "other" media facility mixes media that combine independently. That means that knowing that someone uses a lot of one doesn't say much about whether they use another.
But big television fans are big television fans. If I know that someone watches a lot of TV in general, that suggests they very well may watch more of some particular aspect of television. That is, more television is not independent of the main television plan. For more about this, see below to the section on "Is "Random" Appropriate?"
Adding an "Other" Medium
First, make sure that a demo has been specified, since all entries for other media are created with reference to particular demos. Choose a line of on the Table tab to hold information about another medium. Click, and choose this item on the "components" pop-up menu: "Add Other Medium". This dialog is then presented:
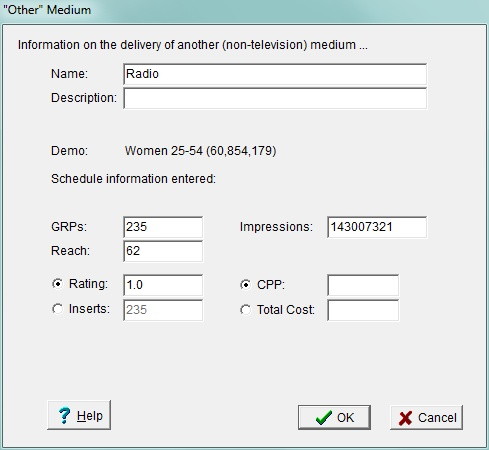
Name and Description

Provide a name for the entered medium. This is how it will be shown on the plansheet and in all reports. Optionally, you can enter a description here for your own reference later.
Plan Details
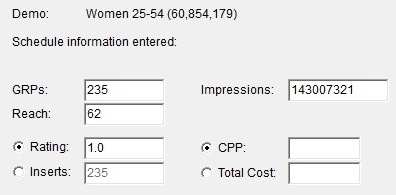
Tell TView what the "other" medium has achieved for the current demo. For the overall schedule size, you can enter either GRPs or impressions. Also enter the reach.
You need to enter either the medium's rating or the number of inserts (spots) you are placing on that medium. (It's either/or because one can be calculated from the other, since we've entered GRPs.) Do whichever is more convenient for you. This does not need to be exact and precise, a rough estimate is fine. For example, a good all-around rating estimate for radio is 1.0.
Optionally, you can enter either CPP or total cost.
Using this New Entry in a Plansheet
Click OK, and the new medium is added to your plan worksheet!
Once the line item has been entered, a GRP value can then be entered into the planning grid, as usual. The television results from TView are then combined (using random duplication) with entries for other media.
If the entry is for the same number of GRPs as used for the definition, then the same reach result will be produced.
Note that entries for other media are defined in terms of a specific demo; if you switch to another demo, you will see that GRP entries are replaced by the red letters "NA".
Default GRP Entry
You can always just type a GRP value into a cell.
Or, hold down the ALT key and click in a plansheet cell for an "other" media, and the GRP value used in its definition will automatically be entered.
Other GRP Entries
This is cool: note that if some other GRP value is entered, TView will estimate what the reach based on the relationship of GRP and reach that was used in the definition. Frequency distributions will also be estimated from this relationship.
Revising An Entry
Point to the name of the "other" medium on your plansheet, and click, giving the popup menu. The command "Edit Other Medium" will produce this same dialog for revising the entry.
Cume Max and Market-Level Results
Since you supplied the only information that TView knows about the entered medium, it is not possible to show a cume max (potential) or market-by-market results for this vehicle, or for plans that use it. We will just see "na" instead.
Technical Details
For added "other" media, TView only knows what you tell it. In order to combine your added medium or vehicle with television, it uses random duplication to come up with total reach estimates.
What Is Random Duplication?
This means that two media vehicles combine in a way that knowing about usage of one tells you nothing about usage of the other. If you tell me that you watch a lot of television, that tells me nothing about how much radio you listen to.
Some people use a lot of media of all types, and some use little, and still others are "compensators" using one and that displaces uses of another. For many combinations of media, it all washes out. We say that such media are independent, and that their usage combines randomly. As a default, TView combines television with "other" media using random duplication.
Calculating Random Duplication
What are the chances that you would get heads in a coin flip, AND a four in a roll of one die? These are clearly independent events, so random duplication works just fine. Probability tells us the odds of both happening is just the multiplication of the odds of each. The chance of getting a head is 1 in 2, or 50%. The chance of getting a four when you roll a die is 1 in 6, or about 16.7%. So, the odds of getting a head and a four is 1/2 times 1/6 equals 1/12 (1 in 12), which is the same as 50% times 16.7% equals 8.3%. That's the chances of getting one AND the other.
When we think about media combinations, we want to know who saw one medium OR the other. The reach of the total is people who saw either or both. So we need to change things a little.
Suppose we still think about a coin and a die. But this time we ask, what are the chance of flipping heads on the coin OR rolling a four on the die? We'll answer that by thinking about what does NOT happen.
We want to know the odds of not getting heads in a coin toss AND not rolling a four with one die. See what we did there? By thinking of what does not happen, we changed this from an "OR" question to an "AND" question.
The chance of not flipping heads is 1 in 2 (50%), the odds of not rolling a four is 5 in 6 (83.3%). As we did above, multiply to find the chance of both happening. So, that's 50% times 83.3%, or 41.6%. So, the chances of neither of these events happening is 41.6%.
As a last step, we just flip it around. If the odds of neither happening is 41.6%, then the odds that something happened (one, or the other, or both) is 100 - 41.6, or 58.4. Chances are 58.4% you would either flip heads or roll a four or both.
Reach of Combined Media
Calculating combined reach is simple and straightforward. Here's how that works:
Total = 1 - (1 - Rt) x (1 - Rx)
For example, if the television reach is 70 (0.70 as a decimal) and an entered radio reach is 40 (0.40 as a decimal), then the total reach is:
Total = 1 - (1 - 0.70) x (1 - 0.40)
Total = .82 = Reach of 82
Here's why that works: By subtracting the reach (as a decimal) from 1, we get the nonreach, that is, the portion of people who have missed our advertising. When we multiply two (or more!) nonreaches together, we're asking how many people are in this group (the nonreach) AND are also in that group AND also in the other group. Multiplied up, that's the people missed by all of our advertising. Subtract that from 1, and we have the final reach of everything together.
USEFUL TIP!
If all you want to do is to combine the reach of two or more media using random dup, it's easy! In fact, it's so easy you can do it with a plain old calculator, and you don't need a computer at all!
Note that in random duplication the order doesn't make a difference: you can combine TV with magazines then radio, or TV with radio then magazines. When we multiply all those nonreaches, the order has no effect. It will all work out the same. |
By the way, you may have been taught this formula for random duplication:
Total = Rt + Rx - (Rt x Rx)
or,
Total = A + B - (A x B)
If you break out your old high school algebra, you'll see that this expresses the exact same thing. We just like the formula we showed above because it's easier to explain why it works, and it's more easily generalized to three or more media.
But! Is "Random" Appropriate?
Sometimes the question comes up about the appropriateness of using "random" duplication. Let's be clear about what "random" means: it says that knowing whether or not someone was exposed to a schedule on one medium gives no clue as to the likelihood of whether they were exposed on another medium. Just because Bob watches a lot of TV doesn't tell me how much he reads magazines. It could be that Bob doesn't read much because he watches a lot of TV, or it could be that Bob is very media savvy and uses a lot of both media. Statisticians would say that these are separate, independent events.
But is this true for real media? Frankly, there exists little data from any single source that would allow anyone to be much more precise. What has been done in this area generally suggests that most different media really do combine pretty much randomly.
Effective Reach and Frequency Distribution of "Other" Media
You provided the reach of the "other" media. But how does TView estimate effective reach, or the frequency distribution?
First, TView has to construct a frequency distribution (if one was not provided by importing results.) TView asks a planner to enter a rating, and a reach estimate at some GRP level. This is sufficient to develop some estimates for the frequency distribution and effective reach. When an "other" medium is added to the T-View plansheet, TView is able to construct a little "mini-model" for an understanding of how that medium could have built audience up to the reach figure that was entered. This mini-model is used to construct an estimated frequency distribution.
Once we have the different frequency distributions for television and the "other" media, combining them works conceptually the same as for the overall reach, except that we must look at every possible combination of cells individually, and then add up the results. We go through all of the frequency levels of television and multiply them by all the cells of the "other" frequency distribution to come up with a whole matrix of counts: the people who have been exposed to this 3 times and that 4 times, or 3 of this and 5 of that, and so on. Finally we add up people who have 0 exposures to anything, 1 exposure to anything, and so, giving us the finished combined distribution. It's a lot of bookkeeping, but not brain surgery.
TView's Modeling of "Other" Media
Let's go a little deeper about that "mini-model" stuff. When you specify the GRPs and reach of a medium, and also some sense (such as ratings or number of inserts) on how accumulation occurred, TView constructs this mini-model fitted to that information. This mini-model is used to add some smarts to TView's handling of the medium. For example, if you enter a value for plan GRPs somewhat different from the GRPs used to define the medium, TView will make a reasonable guess as to how that would change the reach. And even though your definitions did not include a frequency distribution, TView is able to estimate one.
By the way, note that this is the only place in the entire TView system that uses this kind of model of audience behavior! Throughout the rest of the system, calculations are done for every person studied in the original data, one at a time, in a true "respondent level" analysis. |
For most media, the form of the model used for this in TView is called beta-binomial. To most people that's mystifying, but the basic idea is straightforward: the "binomial" part considers whether an individual is likely to see one, two, three or more spots out of a series of some specific number of spots, depending on whether he/she is a heavy viewer, light viewer, or a non-viewer. The "beta" part expresses just how many heavy and light viewers there are. This describes pretty well most media, including radio, newspapers and magazines, in which a specific number of advertisements are placed in the medium.
Some other media have no precise conceptual match for things like "ratings" or "inserts". Outdoor advertising is a good example. Outdoor advertisers talk about "showings" and the number of people exposed in a day, with the number of days serving as a sort of proxy for "inserts". But the reality is that a person might drive by the same billboard ten times a day. Online advertising is even less amenable to the this kind of approach. For such media, a better approach uses a model called gamma-Poisson, or negative binomial. Marketing researcher Jerome Greene describes it, "The gamma-Poisson model ... applies to surveys of frequency of media exposure, in the 'unlimited opportunities' situation in which we cannot know beforehand the highest frequency we will find for any respondent in the total sample. ... Generally the gamma-Poisson model applies to media exposure research when there is no logical or mechanical upper limit on the number of possible exposures per person."