Fusion and Other Ways to Mix Data

Contents
TView provides a number of ways to combine television data with data from entirely different sources. But how it does that, and what makes it possible, can be confusing. So, let's think this through!
What We'd Like To Combine
When you survey a group of respondents about their television viewing, you expect to learn about TV usage among:
| • | sex / age groups |
| • | upper income people |
| • | people in a region or certain markets |
| • | various races |
and so on. Survey companies can pick up details like that when they enlist someone to be part of their survey panel.
But you'd also find it extremely useful to know ...
| • | viewing among people who use certain products |
| • | how TV viewing combines with online/Internet usage |
| • | viewing behaviors tabbed against psychographic or deep demographic measures |
Now, that stuff gets very complicated very fast and usually we do not expect a TV survey company to provide all of that!
So, we wind up wanting to mix data that's coming to us from different directions.

Remember that here in the 21st century, we typically have the luxury of having respondent-level data for all of this. That means that we know what individual people in the survey research have answered, not just percentages of broad groups. (If you're not up on this, do click to learn more!)
Combining Facts from Different Sources
That's terrific, but the puzzle for now is, how do we combine info on TV from some guy in the TV panel, with attitudes discovered for someone in the, say, MRI survey?
The key ingredient that makes it possible to handle fusion data is the respondent ID number. Every home and every person in the television panel is given a unique code. This code stays with the person for as long as they stay in the panel, and it is never reused.
In the Nielsen data in the United States, both the Mid-Minute and the All-Minute data identify carry this respondent ID info, so that's how TView can use those two streams with other data.
Thus, the TV data has these respondent IDs. When there is some other data stream that has the same set of respondent IDs, we can match it to our TV data and use them together. It's like couplers on train cars. We don't have to be too concerned about the content of the cars, just that they have a way of connecting.

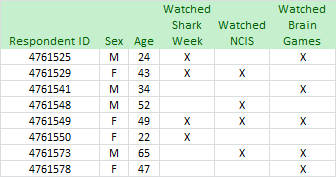
Suppose the TV data looks something like this (it doesn't, but let's just go with it):
Now suppose that the information we get from the MRI fusion data says this:
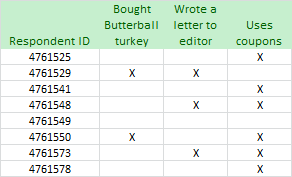
By matching up lines from the two sources using that respondent ID, we discover that respondent #4761550, a 22 year old woman, watched Shark Week, bought a turkey, and uses coupons. (At least according to the data we've been given.)
Yes, But Where Did This Data Come From?
Above we said that this matchup was like connecting train cars; we just needed to find common coupling and did not need to worry about the content of the cars.
But you, being a responsible media researcher, are concerned about the content of the cars.
These new data streams being matched to our TV viewership data do have different kinds of provenance (or origin stories, for superhero fans). Let's look at a few.
More Info from the Same People
The simplest forms of additional data are when the same data supplier gathers additional facts about the very same people. Obviously, in the U.S. the Nielsen company has the home addresses of its panelists. This is very private and secure. But they do know it. Thus they can easily take an address and determine whether that home is in an "A", "B", "C" or "D" county and report that characteristic. They can also take that specific address and run it through software that will determine which PRIZM or other geodemographic cluster it falls into.
The Nielsen Catalina Solutions and Nielsen Buyer Insights services take things a step further. They can match up street addresses from television surveys and also from credit cards. This way they can associate purchases made with that card with specific TV panelists. What's nifty about that is that it matches the very same people, through two different ways of collecting data.
Info from Different People
It gets trickier when the source data is coming from two entirely different sets of people.
Matching respondents is one way of doing this. In the U.S., Nielsen collects television viewing from its television panel, and a different branch of the company collects online Internet usage from a different group of people. To enable us learning insights on how TV and online combine, they mix these two different data streams with a fusion. The idea is to match individuals in the different panels according to characteristics they seem to share. Suppose Alice in the television panel is very much like Barbara in the online panel, judging by their demographics and other factors. Then, Barbara's online usage is simply attributed to Alice. So, we wind up knowing about the estimated online usage for television respondent with a specific respondent ID. Of course, while Alice may similar online usage to Barbara in real life, they might be quite different. But across many, many respondents the pattern of duplication will be good. Great effort is made to confirm that this matchup really does work. Nielsen even maintains a small subset panel to check and calibrate this relationship. (We've excerpted a longer description of this at the bottom of our page discussing how online fusion is developed. To learn more of the juicy details about how the fusion is actually conducted by Nielsen, phone your Nielsen rep.)
A different approach is used by Nielsen and Mediamark (MRI) in their fusions. To estimate how a Nielsen TV respondent might have answered questions in an MRI survey, they use a predictive method. For each specific question in the MRI survey (do you use coupons, have you read Field & Stream, etc.), they build a mathematical model that takes respondents' characteristics as input variables and outputs a yes/no answer for each respondent. The model is tuned to the known results in the MRI survey. Armed then with this model, it is applied to the Nielsen panelists and a yes/no estimate is made for each respondent. A file is produced with all of the predicted values, and each record shows the all-important respondent ID.
Togetherness
The result of all this is that television plans and online plans can be developed and elements from both mixed together in the same plan, or all developed and optimized together. ALL of the tools and reports that can be used with television can also be used with online, or with a mixed plan.
And instead of just basic demographic characteristics, other matched or fused data can tell us about how that TV plan, or TV plus online plan, performed against product purchasers. As long as the data to be matched carries the respondent IDs, we can find ways to merge it with the TV data.