Commercial Formatting and Audience

Contents
Note: This is only available when using the Nielsen All-Minute data. |
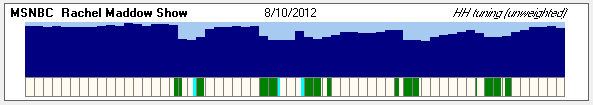
It's interesting and perhaps useful to see how commercial formatting affects audience retention. A rough, quick insight into this is available in TView for specific, individual telecasts. For example, here is a track of household tuning during the duration of one telecast that aired on August 10, 2012:
Here's another, for a drama that aired on June 29, 2014:
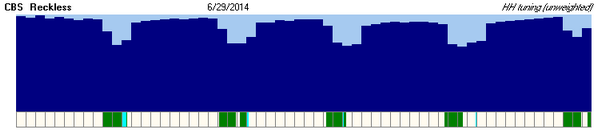
On the bottom, the program is divided into individual block for minutes. Blocks in white are program content, green denotes commercials, and blue marks PSAs or promos.(The sizes of pieces within a minute block are scaled to their times in seconds, but they may not be in the correct order within a minute.)
Above that we see a track of the unweighted household tuning in each minute. We can see that each commercial pod has an impact on the household tuning, which may recover after the pod is completed.
Here's what to do:

| 1. | Go to the "Programs" tab and click "Get Programs" |
| 2. | Click the "Telecasts" button just below it |
| 3. | Find a telecast of interest, and click on it to select it. |
| 4. | The chart will be shown under the list. |
Copy and Save
You can right-click on the chart to copy it or to save it to disk.